

Importers and exporters around the world are paying record high shipping rates but receiving appalling levels of service reliability, confirms the latest quarterly review of the container shipping market issued today (5 March) by MDS Transmodal and the Global Shippers’ Forum.
The second in-depth survey of eight key performance indicators measuring activities in the global container shipping market reports data for the final quarter of 2020 and correlates the rapid recovery of world trade with the behaviour of rates and service performance experienced by cargo owners. The findings are summarised in the Global Shippers Dashboard for Q4 2020 reproduced below:
Status colour code:
Red = adverse development or trend (from shippers’ perspective)
Amber = neutral or concerning development or trend (from shippers’ perspective)
Green = improving development or trend (from shippers’ perspective)
1. Trade volumes
Global trade recovered to pre-Covid levels and in Q4 and escalated beyond, especially in ex-Far East trades, as consumers replaced spending on services with physical goods. This was the busiest period in world trade, ever.
2. Shipping capacity
There is virtually no greater shipping capacity available at the end of 2020 than at the start of the year. Container shipping lines have attempted to meet the growth in demand with the same overall capacity and numbers of vessels.
3. Capacity utilisation
Utilisation levels reached 100% on headhaul trades. Container vessels are full, driving up spot rates and the numbers of missed shipments (rolled cargoes) on most services from the Far East to Europe and North America
4. Carrier costs & revenues
Unit revenues increased 25% on average during Q4 2020 whilst vessel operating costs showed only modest increase mainly due to higher chartering costs. There are no underlying cost pressures on rates.
5. Market competitiveness
New analysis reveals that all shipping lines operating in the Far East – North America corridors exceed 30% market share – the threshold above which anti-trust immunity provisions do not apply. The enforceability of this threshold must be addressed by Competition Authorities.
6. Port connectivity
The top 10 best connected ports remain unchanged despite service frequency and destination fluctuations during 2020.
7. Service performance
Service predictability for shippers fell further during Q4 2020 and vessels missed more scheduled port calls than in the previous five years. Shippers are paying record rates for historically poor service levels.
8. Carbon dioxide emissions
CO2 emissions per container moved have remained broadly flat since 2016, awaiting new global reduction measures to be implemented.
The two ‘Graphs of the Quarter’ show the very high levels of utilisation of deployed capacity (now effectively 100%) on head-haul trades and the dramatic decline in reliability and consistency of vessel arrivals at ports, and hence the availability of imported cargoes to shippers.
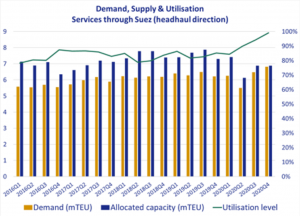
Graph 1: In Q4 2020 utilisation of container space reached 100% (green line, right-hand scale), whilst global demand (i.e. unitised world trade – orange bars, left-hand scale) exceeded 2019 levels and ‘caught up’ with the deployed capacity (blue bars). This was no greater capacity on headhaul services available than in Q3 2020 and significantly less than in 2019. (These levels are monitored for vessels passing through the Suez Canal, the highest concentration of container shipping in the world and is considered a reliable proxy for global conditions).
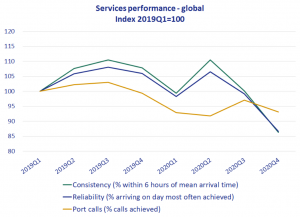
Graph 2: In Q4 2020 the number of occasions vessels made a scheduled port call within 6 hours of their average arrival time fell by 15 percentage points (Green line). A similar fall was recorded for vessels arriving on the day they were expected (Blue line). The number of scheduled calls actually made fell back, meaning, in an increasing number of cases, the port call was skipped all together.
Mike Garratt, Chairman of MDS Transmodal, commented:
“Q4 2020 saw the largest ever quarterly volume of container traffic globally while annual volumes almost reached 2019 levels despite the pandemic, carried on a fleet capacity that had hardly changed. Demand growth was at its strongest on the East-West routes linking Far East manufacturers with consumers in North America and Europe. As a mathematical consequence Q4 utilization levels hit record levels, with the apparent consequence of deteriorating service reliability, more port calls missed and rapidly rising freight rates. The impact on connectivity and emissions was broadly neutral.”
James Hookham, Secretary General of Global Shippers Forum, commented:
“The recent extraordinary patterns of world trade have maxed-out the available capacity of the container shipping fleet, forcing rates to their current eye-watering levels. On top of that, shippers are having to play guess-work on the arrival dates and times of their containers. Top rates for declining service levels – this cannot continue”
“This second Review of the container shipping market shows we are serious about monitoring its behaviour and highlighting the impacts on the world’s importers and exporters as they work to restore something like normality to world trade. There is too much red-ink in this Review!”
Notes for Editors:
- The Container Shipping Market Quarterly Review is produced every three months and reports, interprets and comments on trends and developments in the container shipping market as experienced and understood by shippers – the importers and exporting businesses that own the cargo carried by container shipping lines. Shippers are the ultimate customers of the container shipping industry.
- The Review collates and reports outputs from MDST’s established and respected Container Business Modal and other tools that are relied upon by governments and international agencies around the world. Working with GSF, MDST has generated eight new indicators showing how the market is performing in terns that are relevant and applicable to shippers as users and customers of these services.
- The eight indicators will be updated each quarter as new data becomes available All data is derived from publicly available sources but MDST and GSF believe this the first time they have been used to provide a ‘customer’ perspective on container shipping developments.
- The Container Shipping Market Quarterly Review for Quarter 3 2020 may be downloaded from here
- MDS Transmodal (MDST, www.mdst.co.uk) is a UK firm of transport economists which specialises in maritime and all other modes of freight transport. MDST works with senior management in the public and private sectors to provide strategic advice based on quantitative analysis, modelling and sectoral expertise. All the data and graphs presented in the GSF/MDST Container Shipping Market Quarterly Review can be provided at a more detailed level, e.g. trade data by country pairs as well as individual commodities, capacity and services performances by service and operator, etc. Mike Garratt, Chairman of MDS Transmodal, is available for interview. Please contact +44 (0) 1244 348301
- Global Shippers Forum (www.globalshippersforum.com) is the global business organisation speaking up for exporters and importers as cargo owners in international supply chains and trade procedures. Its members are national and regional shippers’ associations representing hundreds of manufacturing, wholesaling, and retailing businesses in over 20 countries across five continents. GSF works for safe, competitively efficient, and environmentally sustainable global trade and logistics. James Hookham, Secretary General of GSF, is available for interview. Please contact: +44 7818 450440
GSF MDST Shippers paying record rates for deteriorating service 210305


